How to view each probe set entry
Annotation
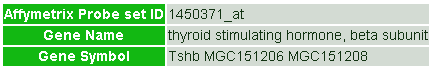
Figure 1. Annotation.
You can view annotation of the probe set. The annotation include probe set ID, gene name, gene symbols and synonyms.
Expression
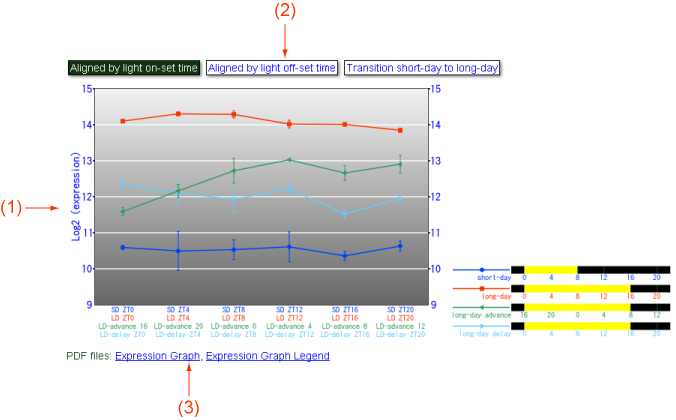
Figure 2. Expression.
The expression values of the probe set can be shown in this view. (1) A line chart showing expression values of PT under chronical conditions. (2) You can switch three charts by click a button: "Aligned by light on-set time," time-points were shifted so that lights on timings (SD=ZT0, LD=ZT0, LD-advance=ZT16, LD-delay=ZT0) are aligned; "Aligned by light off-set time," time-points were shifted so that lights off timings (SD=ZT8, LD=ZT16, LD-advance=ZT8, LD-delay=ZT16) are aligned; "Transition short-day to long-day," short-day, long-day advance, and long-day delay expressions are arranged to show SD-to-LD transition. (3) These images in the PDF format can be downloaded here. You can use and modify these images by your own purposes.
Data downlaod

Figure 3. Data download menu.
You can download Photoperiodism expression data for the probe set in a table. You can download a table of the expression data in TSV or CSV formats.
Reference to external databases
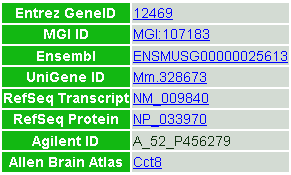
Figure 4. List of references to external databases.
References to corresponding external entries in the other public databases (Entrez Gene in NCBI, MGI in the Jackson Laboratory, Ensembl in EBI, UniGene in NCBI, RefSeq in NCBI, Agilent probes and Allen Brain Atlas in the Allen Institute) are shown.
Go to the documents page